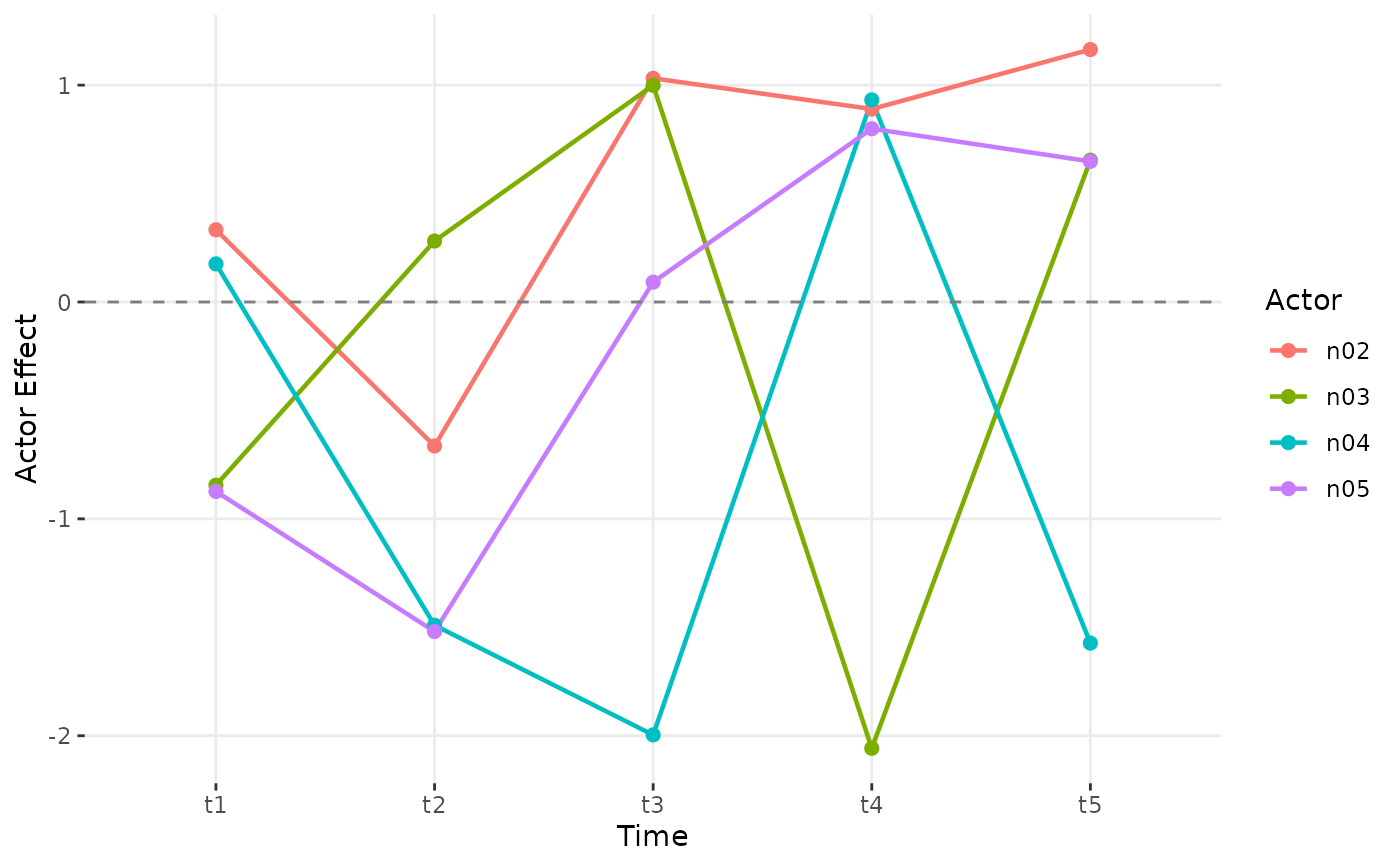
Creates a line plot of actor or partner effects across time points.
Usage
srm_trend_plot(object, type = c("actor", "partner"), actors = NULL, n = 8)Creates a line plot of actor or partner effects across time points.
srm_trend_plot(object, type = c("actor", "partner"), actors = NULL, n = 8)