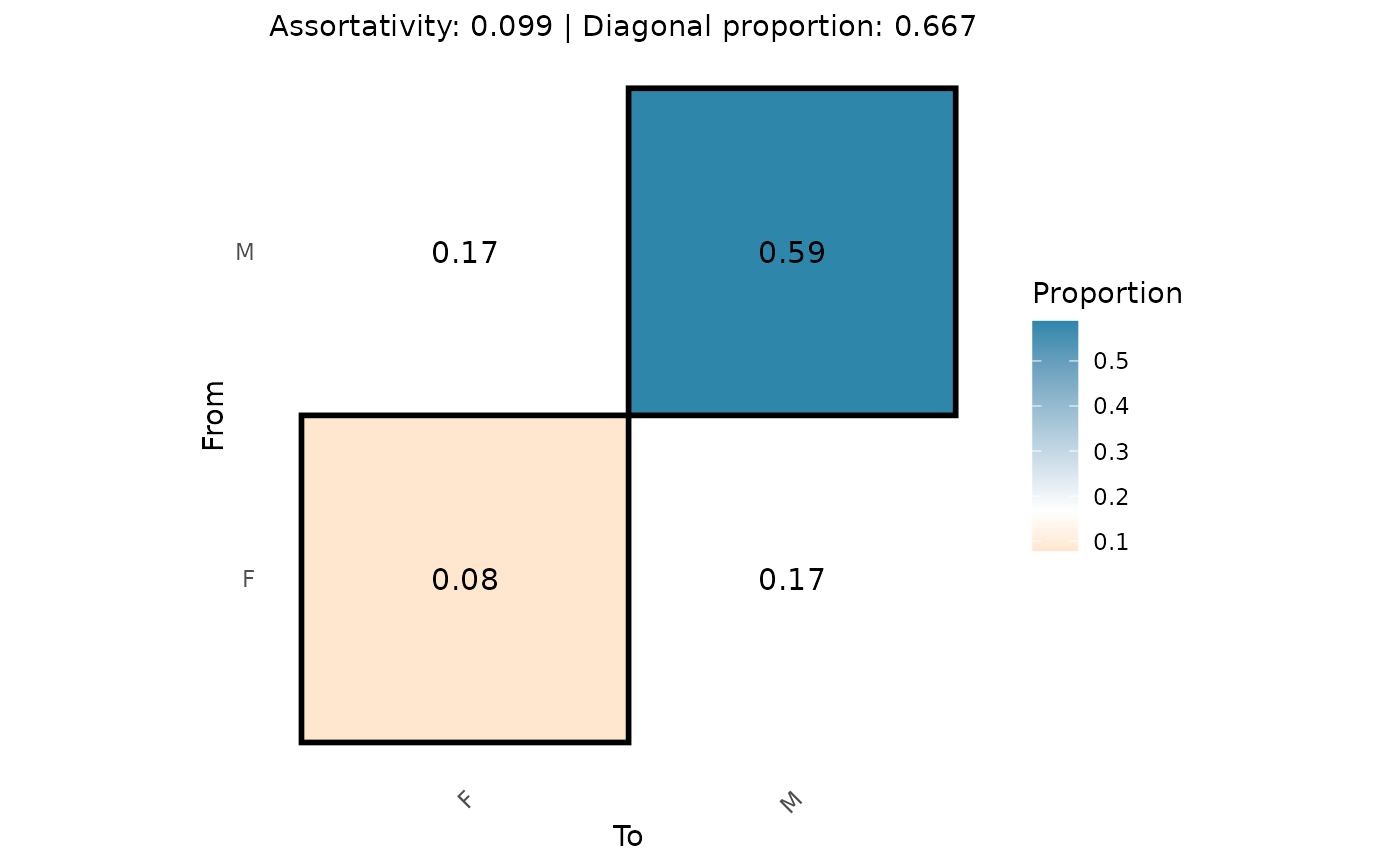
creates heatmap visualizations for attribute mixing matrices from mixing_matrix().
the function creates a tile plot showing how different attribute categories interact in the network.
Usage
plot_mixing_matrix(
  mixing_results,
  which_matrix = 1,
  show_values = TRUE,
  value_digits = 2,
  color_scale = c("#F18F01", "white", "#2E86AB"),
  midpoint = NULL,
  text_size = 4,
  text_color = "black",
  text_color_threshold = NULL,
  tile_border_color = "white",
  tile_border_size = 0.5,
  reorder_categories = FALSE,
  diagonal_emphasis = TRUE,
  ...
)
Arguments
- mixing_results
output from
mixing_matrix()containing mixing matrices and summary statistics.- which_matrix
integer or character. which matrix to plot if multiple are present. default is 1 (first matrix).
- show_values
logical. whether to display values in each tile. default TRUE.
- value_digits
integer. number of decimal places for displayed values. default 2.
- color_scale
character vector of three colors for low, mid, and high values. default uses a diverging color scale.
- midpoint
numeric. the midpoint for the diverging color scale. default NULL automatically calculates based on data range.
- text_size
numeric. size of value labels in tiles. default 4.
- text_color
character. color of text labels. default "black".
- text_color_threshold
numeric. if provided, values above this threshold (0-1 scale) will use white text, values below will use black text. default NULL uses text_color for all.
- tile_border_color
character. color of tile borders. default "white".
- tile_border_size
numeric. width of tile borders. default 0.5.
- reorder_categories
logical. whether to reorder categories by similarity. default FALSE.
- diagonal_emphasis
logical. whether to emphasize diagonal cells (within-group mixing). default TRUE.
- ...
additional arguments passed to ggplot2 functions.
Examples
# \donttest{
# create a network with categorical attributes
data(classroom_edges)
data(classroom_nodes)
net <- netify(
    classroom_edges,
    actor1 = "from", actor2 = "to",
    symmetric = TRUE,
    nodal_data = classroom_nodes
)

# run mixing matrix analysis
mixing_result <- mixing_matrix(
    net,
    attribute = "gender"
)

# create visualization
plot_mixing_matrix(mixing_result)

# }
# }