create a multi-panel mixing matrix visualization
Source:R/plot_mixing_matrix.R
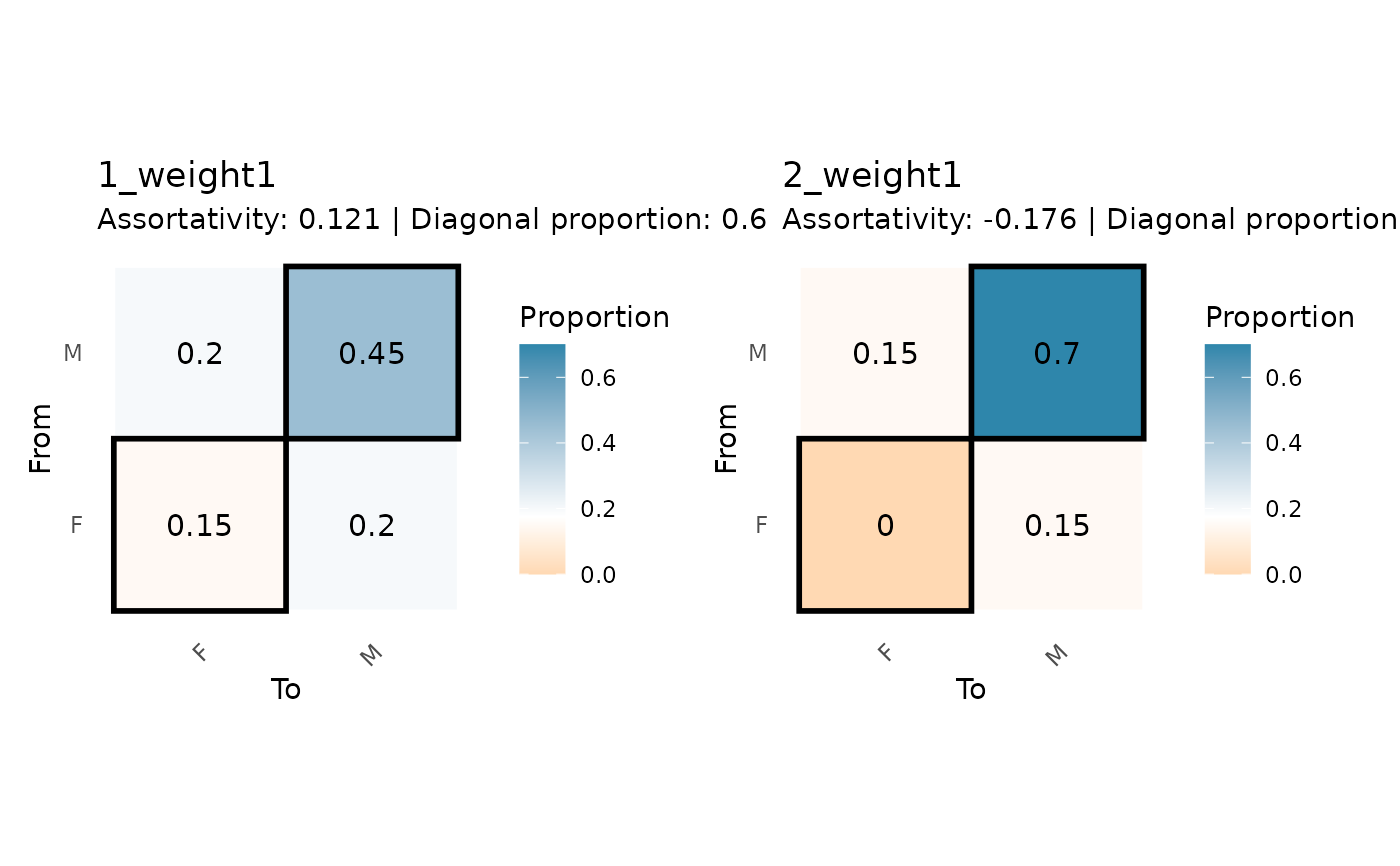
plot_mixing_matrix_facet.Rdcreates a faceted plot showing multiple mixing matrices, useful for comparing patterns across time periods or network layers.
Usage
plot_mixing_matrix_facet(
  mixing_results,
  matrices_to_plot = NULL,
  ncol = NULL,
  shared_scale = TRUE,
  ...
)
Arguments
- mixing_results
output from
mixing_matrix()with multiple matrices- matrices_to_plot
integer vector. which matrices to include. default NULL plots all.
- ncol
integer. number of columns in facet layout. default NULL auto-calculates.
logical. whether to use the same color scale across panels. default TRUE.
- ...
additional arguments passed to plot_mixing_matrix for each panel
Examples
# \donttest{
# create temporal network
data(classroom_edges)
data(classroom_nodes)
classroom_panel <- rbind(
    transform(classroom_edges[1:20, ], wave = 1),
    transform(classroom_edges[21:40, ], wave = 2)
)
classroom_nodes_panel <- rbind(
    transform(classroom_nodes, wave = 1),
    transform(classroom_nodes, wave = 2)
)
net_temporal <- netify(
    classroom_panel,
    actor1 = "from", actor2 = "to", time = "wave",
    symmetric = TRUE,
    nodal_data = classroom_nodes_panel
)

# run mixing matrix analysis across time
mixing_temporal <- mixing_matrix(
    net_temporal,
    attribute = "gender"
)

# create faceted visualization
plot_mixing_matrix_facet(mixing_temporal, ncol = 2)
#> Scale for fill is already present.
#> Adding another scale for fill, which will replace the existing scale.
#> Scale for fill is already present.
#> Adding another scale for fill, which will replace the existing scale.

# }
# }