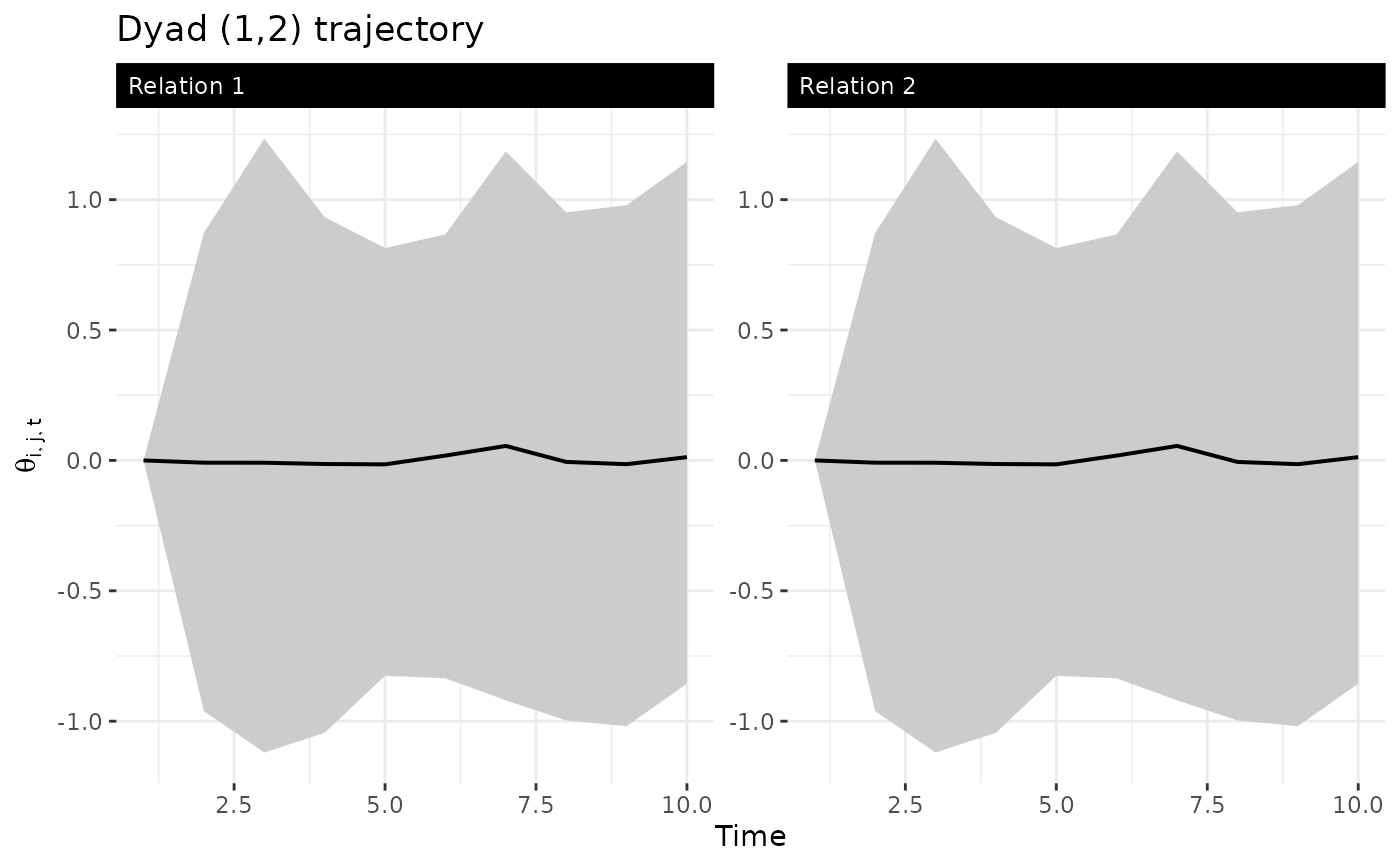
Plots posterior mean and 95% bands for a single dyad through time
Usage
dyad_path(fit, i, j, rel = NULL, facet = TRUE, cred = c(0.025, 0.975))Examples
# \donttest{
sim <- simulate_dynamic_dbn(n = 6, time = 10, seed = 1)
fit <- dbn(sim$Y, model = "dynamic", nscan = 200, burn = 100, verbose = FALSE)
dyad_path(fit, i = 1, j = 2)

# }
# }