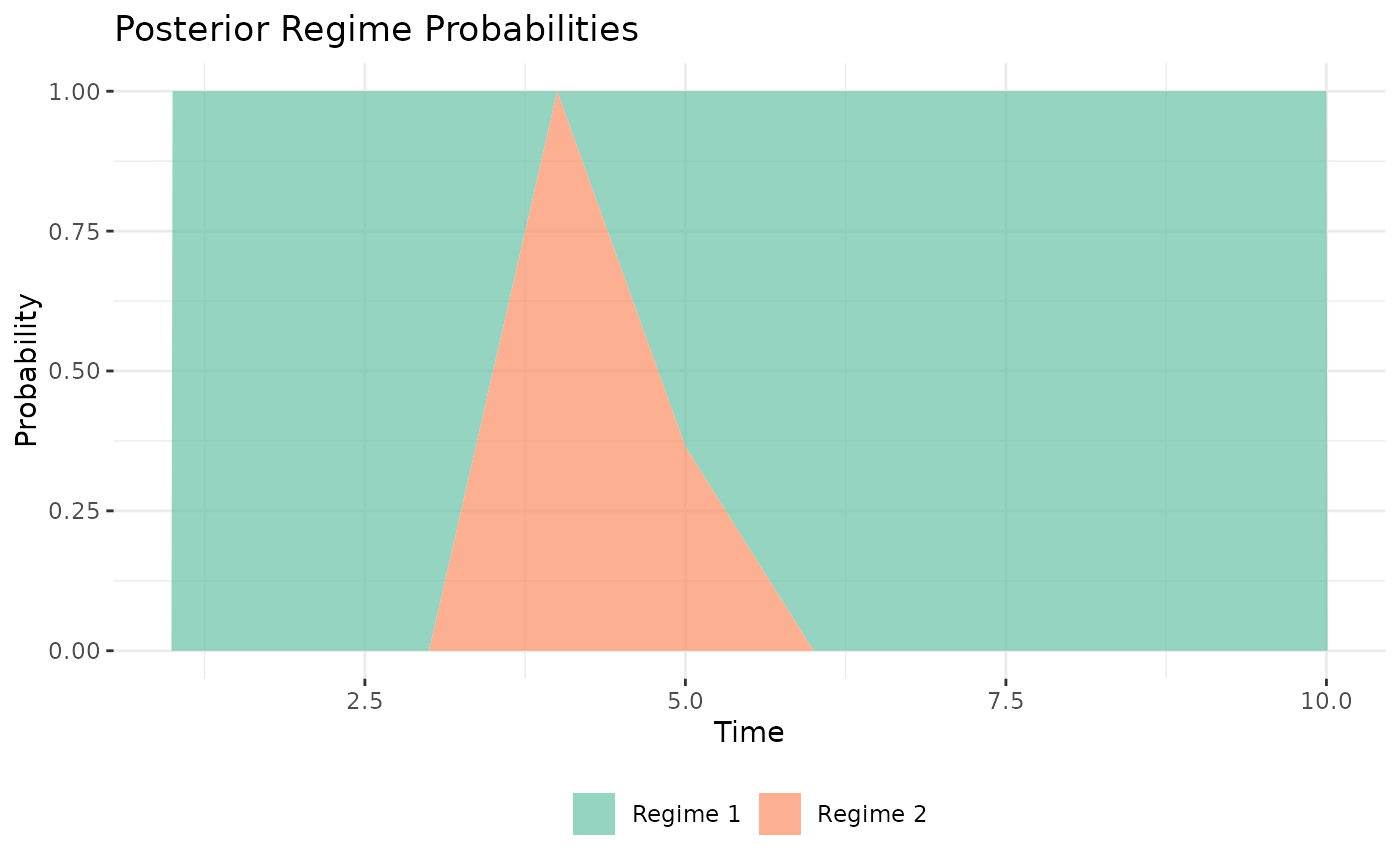
Stacked area plot of posterior regime probabilities over time (HMM only)
Examples
# \donttest{
sim <- simulate_hmm_dbn(n = 6, time = 10, R = 2, seed = 1)
fit <- dbn(sim$Y, model = "hmm", R = 2, nscan = 200, burn = 100, verbose = FALSE)
if (requireNamespace("ggplot2", quietly = TRUE)) plot_regime_probs(fit)

# }
# }