Skip to contents

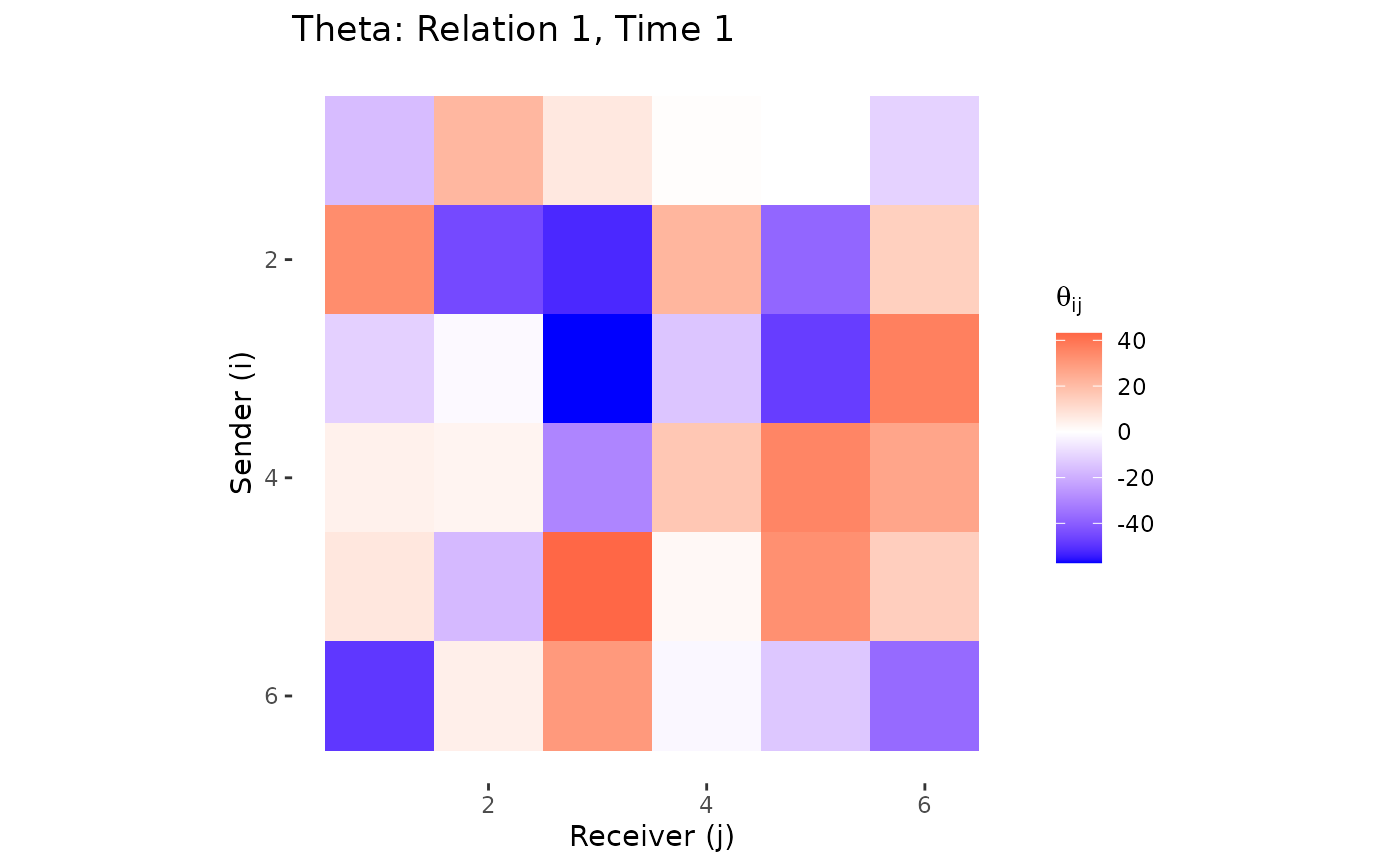
Posterior mean of Theta as a heatmap

Usage

plot_theta(fit, time = 1, rel = 1, fun = mean, ...)

Arguments

fit

A dbn model fit object

time

Time point to plot

rel

Relation to plot

fun

Summary function (default: mean)

...

Additional arguments to theta_summary

Value

A ggplot object or NULL

Examples

# \donttest{
sim <- simulate_dynamic_dbn(n = 6, time = 5, seed = 1)
fit <- dbn(sim$Y, model = "dynamic", nscan = 200, burn = 100, verbose = FALSE)
if (requireNamespace("ggplot2", quietly = TRUE)) plot_theta(fit)

# }