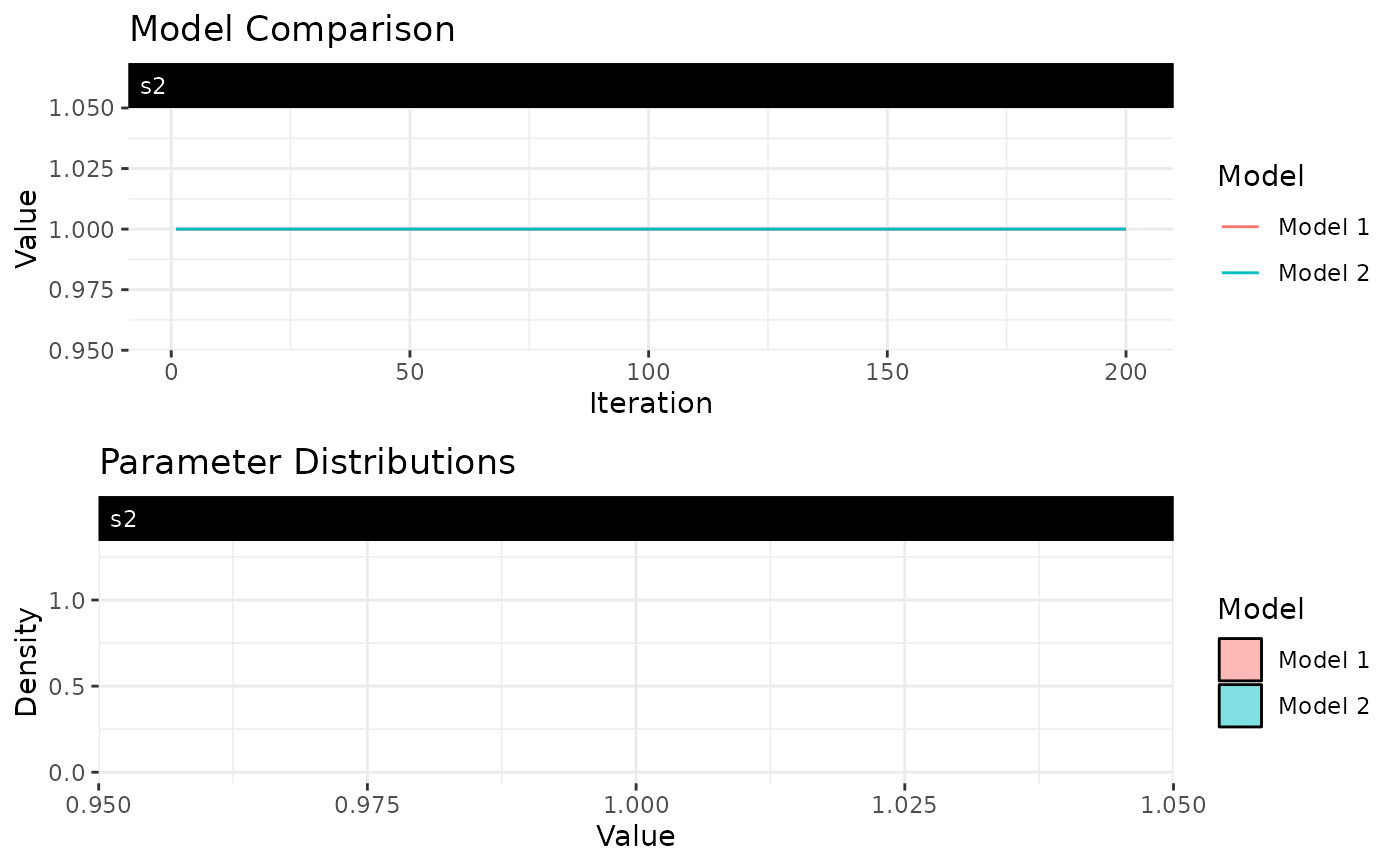
Creates side-by-side trace plots of scalar variance parameters from two or more fitted DBN models. Useful for comparing convergence behavior across different model specifications (e.g., static vs. dynamic, different ranks, different families).
Examples
# \donttest{
sim <- simulate_static_dbn(n = 6, time = 10, seed = 1)
fit1 <- dbn(sim$Y, model = "static", nscan = 200, burn = 100, verbose = FALSE)
fit2 <- dbn(sim$Y, model = "static", nscan = 200, burn = 100, verbose = FALSE)
compare_dbn(fit1, fit2)

# }
# }