Creates model-specific diagnostic plots for a fitted DBN object. The type of plot depends on the model variant:
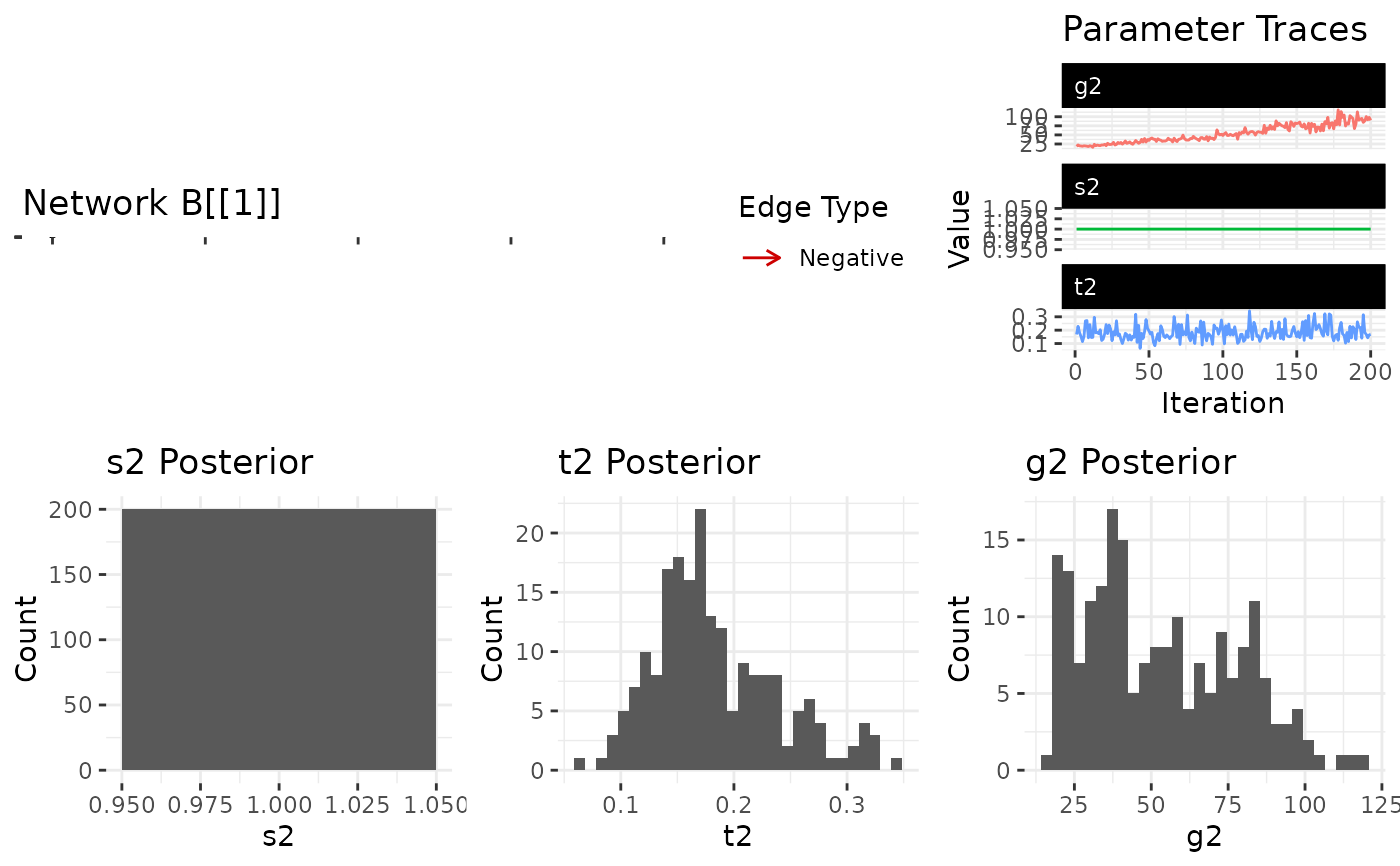
Static: trace plots, posterior histograms, and a network summary of the estimated B matrix.
Dynamic: trace plots for variance parameters and, if available, time-varying A/B summaries.
Lowrank: trace plots, estimated factor trajectories (\(\alpha_t\)), and the posterior mean node-loading matrix U.
HMM: regime probabilities over time, the estimated transition matrix, and MCMC trace plots.
Piecewise: trace plots for each regime block.
Usage
# S3 method for class 'dbn'
plot(x, ...)
Arguments
- x
A fitted
dbnobject returned bydbn().- ...
Additional arguments passed to model-specific plot functions (e.g.,
alphafor edge significance in the static model).
Examples
# \donttest{
sim <- simulate_static_dbn(n = 8, time = 10, seed = 6886)
fit <- dbn(sim$Y, model = "static", nscan = 200, burn = 100, verbose = FALSE)
plot(fit)

# }
# }