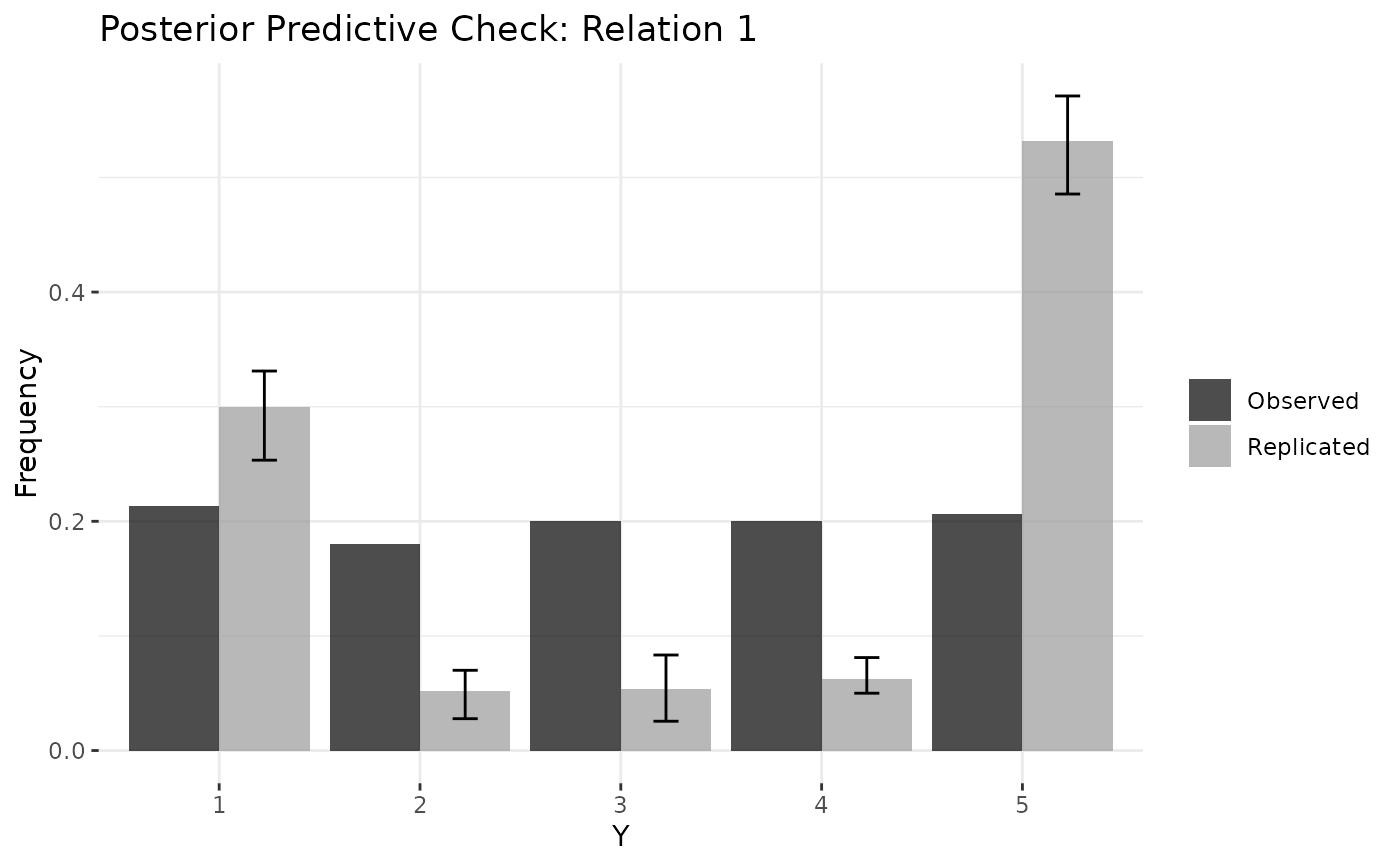
Plot density of observed vs replicated data
Examples
# \donttest{
sim <- simulate_static_dbn(n = 6, time = 5, seed = 1)
fit <- dbn(sim$Y, model = "static", nscan = 200, burn = 100, verbose = FALSE)
ppd <- posterior_predict_dbn(fit, ndraws = 5)
if (requireNamespace("ggplot2", quietly = TRUE)) plot_ppc_density(fit, ppd, Y_obs = sim$Y)

# }
# }