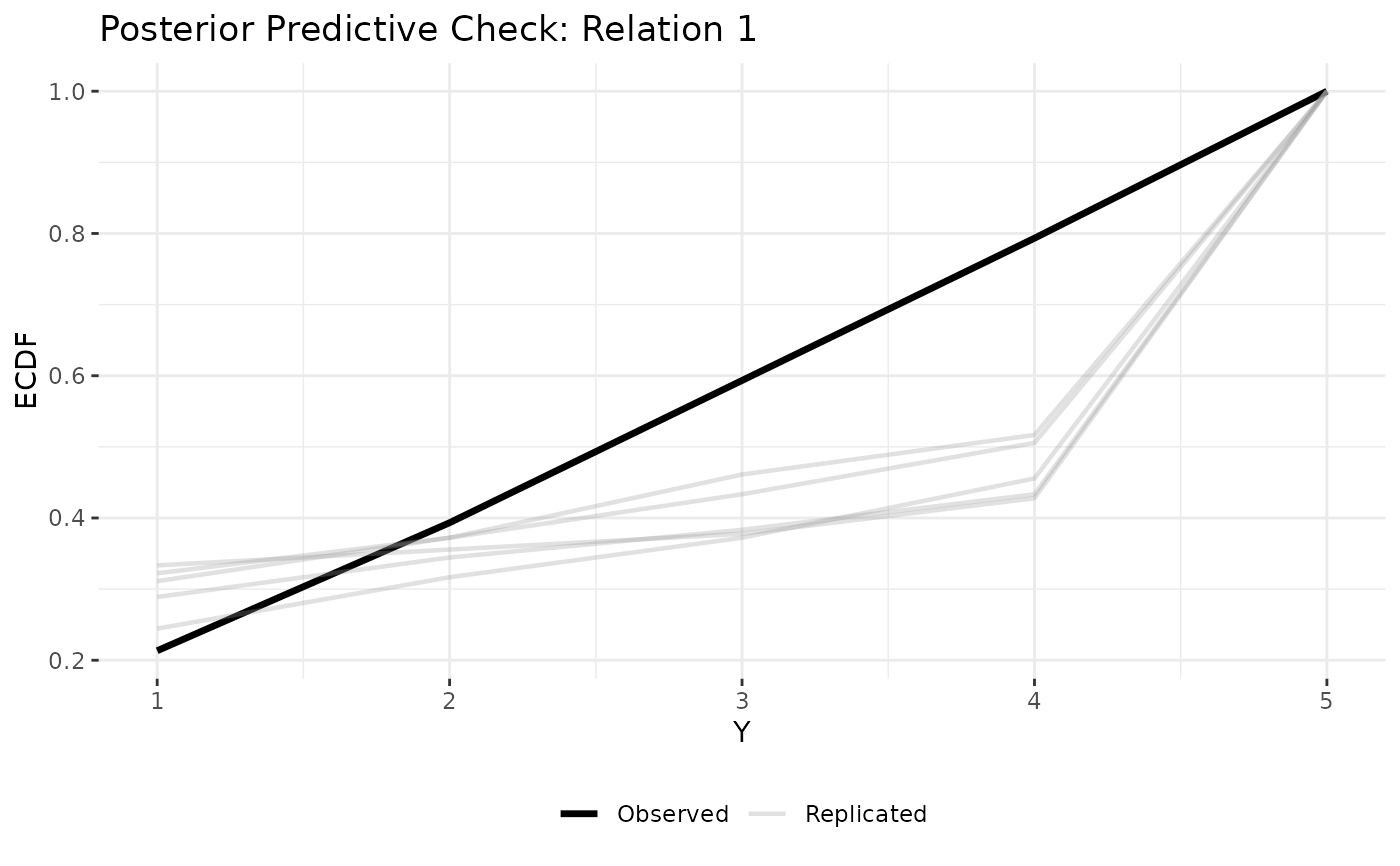
Plot empirical CDFs of observed vs replicated data
Usage
plot_ppc_ecdf(
  fit,
  ppd = NULL,
  ndraws_plot = 20,
  alpha = 0.3,
  rel = 1,
  time = NULL,
  Y_obs = NULL
)
Arguments
- fit
A dbn model fit object
- ppd
Posterior predictive samples (from posterior_predict_dbn)
- ndraws_plot
Number of replicates to show (default: 20)
- alpha
Transparency for replicate lines (default: 0.3)
- rel
Relation index to plot (default: 1)
- time
Time index to plot (default: all)
- Y_obs
Observed data array (required)
Examples
# \donttest{
sim <- simulate_static_dbn(n = 6, time = 5, seed = 1)
fit <- dbn(sim$Y, model = "static", nscan = 200, burn = 100, verbose = FALSE)
ppd <- posterior_predict_dbn(fit, ndraws = 5)
if (requireNamespace("ggplot2", quietly = TRUE)) plot_ppc_ecdf(fit, ppd, Y_obs = sim$Y)

# }
# }