Getting Started with lame
Cassy Dorff, Shahryar Minhas, and Tosin Salau
2026-09-08
Source:vignettes/lame.Rmd
lame.RmdWhat Is lame?
Networks of trade, conflict, alliance, friendship, and sanction share
a common inferential difficulty: the tie between two actors is rarely
independent of the ties around it. A more central actor sends more,
attracts more, and shifts the incentives of every actor sharing a
neighbour. The lame package fits
Longitudinal Additive and
Multiplicative Effects models to this
kind of data. It estimates covariate effects on the directed tie scale
while accounting for sender heterogeneity, receiver heterogeneity,
reciprocity, and the residual relational structure that covariates alone
cannot capture.
The model decomposes each tie into three pieces. Every actor has a tendency to send ties () and to receive ties (), reflecting how active and how popular they are. Each actor also occupies a latent position ( as a sender, as a receiver) so that actors with similar positions tend to form similar tie patterns. Covariates shift the baseline probability of ties on top of those actor-level pieces. When observations span multiple periods, any of these components can evolve over time via an AR(1) process – short for “autoregressive of order 1”, meaning each period’s value is a slightly noisy copy of the previous period’s value (so positions drift smoothly rather than jumping around).
Coming from a tidy edgelist? Use netify
If your data lives in a long-format edgelist, build a
netify object and pass it directly to lame()
or ame(). netify handles the matrix
construction, actor ordering, bipartite row/column sets, changing actor
composition, and dyadic or nodal covariates:
library(netify)
library(lame)

netlet <- netify::netify(
    edges_long,
    actor1 = "from", actor2 = "to", time = "year",
    weight = "tie",
    dyad_vars = "distance",
    output_format = "longit_list",
    missing_to_zero = FALSE
)

fit <- lame(netlet, family = "binary", R = 2, verbose = FALSE)
Use missing_to_zero = TRUE only when unlisted dyads are
real zeros; if an unlisted dyad means the relation was not observed,
keep it FALSE so those cells enter lame as
missing values. The underlying shape contract is still simple –
lame() consumes a named list of matrices plus optional
per-period covariate arrays – and the overview vignette walks through an
executed netify round-trip on real data.
A 5-Minute Example
Let’s fit a model to a small longitudinal binary network with one
dyadic covariate (a bilateral similarity score that drives tie
formation). The truth is intercept = -1.0 and the covariate
effect is beta = 0.7.
library(lame)
set.seed(6886)

# simulate 3 time periods of a 25-node directed network with a
# dyadic similarity covariate driving the ties.
n <- 25; T_periods <- 3
true_intercept <- -1.0
true_beta      <- 0.7

# zero-padded names ("N01" ... "N25") sort the same way alphabetically as
# positionally, so `lame()`'s internal alphabetic actor sort leaves the
# row order unchanged. with non-padded names ("N1", "N10", "N2", ...) the
# stored output comes back in sorted order, not your input order -- the fit
# is still correct as long as Y and the X arrays share the same names.
# explicit dimnames on Y and every covariate array are the safe way to
# guarantee that alignment.
actor_names <- sprintf("N%02d", seq_len(n))

X_list <- lapply(seq_len(T_periods), function(t) {
    # 3-D array [actor x actor x covariate]; the third-dim name becomes
    # the coefficient label downstream
    x <- matrix(rnorm(n * n), n, n)
    array(x, dim = c(n, n, 1),
          dimnames = list(actor_names, actor_names, "similarity"))
})
Y_list <- lapply(seq_len(T_periods), function(t) {
    # build the linear predictor eta = intercept + beta * X (the same
    # arithmetic a logistic / probit regression would do). then push it
    # through pnorm() -- the standard-normal CDF -- to turn it into a
    # tie probability in [0, 1]. that CDF link is what "probit" means,
    # and it is the link `family = "binary"` uses inside `lame()`. finally,
    # draw a 0/1 tie from a Bernoulli with that probability.
    #
    # the `[, , 1]` peels the first (and only) covariate slice off the
    # 3-D array, leaving an n x n matrix. third-dim index = covariate.
    eta <- true_intercept + true_beta * X_list[[t]][, , 1]
    Y   <- matrix(rbinom(n * n, 1, pnorm(eta)), n, n)
    diag(Y) <- NA   # self-ties are undefined in a unipartite network
    rownames(Y) <- colnames(Y) <- actor_names
    Y
})

# fit a longitudinal AME model with the dyadic similarity covariate.
fit <- lame(
    Y = Y_list,
    Xdyad = X_list,         # one similarity matrix per period
    R = 2,                  # 2D latent space
    family = "binary",      # probit for 0/1 networks
    burn = 20,              # compact burn-in for this example
    nscan = 100,            # compact post-burn-in run for the vignette
    odens = 5,              # thinning
    verbose = FALSE,        # suppress the progress bar / iteration log
    plot = FALSE            # don't pop up live MCMC diagnostic plots during sampling
                            # `lame()` draws live diagnostics when plot = TRUE;
                            #  `ame()` accepts plot = for signature parity but ignores it
                            #  -- the single-period sampler has no live plotting
)

summary(fit)
#>
#> === Longitudinal AME Model Summary ===
#>
#> Call:
#> [1] "Y ~ dyad(similarity) + a[i] + b[j] + rho*e[ji] + U[i,1:2] %*% V[j,1:2], family = 'binary'"
#>
#> Time periods: 3
#> Family: binary
#> Mode: unipartite
#>
#> Note: STATIC fit pooled across 3 time periods --
#>   U, V, a, b are time-invariant; per-period predictions vary
#>   only through per-period covariates. For time-varying effects,
#>   refit with dynamic_uv = TRUE and/or dynamic_ab = TRUE.
#>
#> Regression coefficients:
#> ------------------------
#>                 Estimate StdError z_value p_value CI_lower CI_upper
#> intercept         -1.112    0.034 -32.307       0   -1.169    -1.06 ***
#> similarity_dyad    0.742    0.051   14.51       0    0.646    0.813 ***
#> ---
#> Signif. codes: 0 '***' 0.001 '**' 0.01 '*' 0.05 '.' 0.1 ' ' 1
#> Note: stars are a visual hint from posterior mean / SD only; for inference use the credible intervals.
#>
#> Variance components:
#> -------------------
#>     Estimate StdError
#> va     0.055    0.012
#> cab    0.000    0.018
#> vb     0.065    0.034
#> rho   -0.052    0.099
#> ve     1.000    0.000
#>   (va = sender, cab = sender-receiver covariance, vb = receiver,
#>    rho = dyadic correlation, ve = residual variance)
The intercept lands near the true -1.0 and
similarity_dyad lands near the true 0.7, the
basic sanity check that the sampler is recovering known parameters. The
_dyad suffix on the coefficient name flags that the
covariate is a pair-level quantity; sender-only and receiver-only
covariates carry _row and _col suffixes
respectively. The remaining variance components describe residual
actor-level and dyad-level structure that the covariate alone does not
explain:
-
va: variance of the sender random effects, capturing how much actors differ in their overall tendency to send ties. -
vb: variance of the receiver random effects, capturing how much they differ in their tendency to receive. -
cab: covariance between sender and receiver effects within an actor, indicating whether prolific senders are also frequent receivers. -
rho: within-dyad residual correlation, capturing reciprocity beyond what the additive effects and covariates explain.
A note on MCMC settings. The three key parameters
are burn (iterations discarded as burn-in),
nscan (post-burn-in iterations kept for inference), and
odens (thinning: keep every odens-th sample to
reduce autocorrelation). With the settings above, we store
nscan / odens = 100 / 5 = 20 posterior samples (kept small
for vignette build time). For a final run, aim for at least 1000 stored
samples with adequate effective sample sizes
(e.g. burn = 1000, nscan = 25000, odens = 25).
What Can You Do with a Fitted Model?
lame objects work with all the standard R methods you’d
expect:
# regression coefficients (posterior means)
coef(fit)
#>       intercept similarity_dyad
#>      -1.1116591       0.7415237

# 95% credible intervals
confint(fit)
#>                      2.5%      97.5%
#> intercept       -1.168612 -1.0596470
#> similarity_dyad  0.646386  0.8126144

# broom-style one-row-per-coefficient frame; ships with lame so it works
# without broom installed and dispatches through broom::tidy(fit) when
# broom is loaded. glance(fit) gives the one-row model summary that
# modelsummary uses for its lower panel. See the overview vignette for
# the full modelsummary / tidybayes / autoplot round-trip.
tidy(fit)
#> # A tibble: 2 × 7
#>   term            estimate std.error statistic p.value conf.low conf.high
#>   <chr>              <dbl>     <dbl>     <dbl>   <dbl>    <dbl>     <dbl>
#> 1 intercept         -1.11     0.0344     -32.3       0   -1.17     -1.06
#> 2 similarity_dyad    0.742    0.0511      14.5       0    0.646     0.813

# n_row_actors / n_col_actors are bipartite-only and are NA on a unipartite
# fit like this one. elpd_loo is NA unless the model was fit with
# save_log_lik = TRUE and the loo result cached via fit$loo <- loo(fit).
glance(fit)
#> # A tibble: 1 × 13
#>    nobs n_actors n_row_actors n_col_actors n_periods n_stored family mode      R
#>   <int>    <int>        <int>        <int>     <int>    <int> <chr>  <chr> <int>
#> 1  1800       25           NA           NA         3       20 binary unip…     2
#> # ℹ 4 more variables: dynamic_uv <lgl>, dynamic_ab <lgl>, dynamic_beta <lgl>,
#> #   elpd_loo <dbl>

# predicted probabilities for every dyad at every time point.
# for a `lame()` fit (panel data), `predict()` returns a *list of length T*,
# where T is the number of time periods. Each element is an n x n matrix of
# posterior-mean predicted tie probabilities (between 0 and 1, since
# family = "binary"). For a single-period `ame()` fit, predict() returns
# the n x n matrix directly, not wrapped in a list.
Y_hat <- predict(fit, type = "response")
length(Y_hat)                      # 3, one matrix per period
#> [1] 3
dim(Y_hat[[1]])                    # 25 x 25
#> [1] 25 25
cat("Predicted probability range:",
        round(range(unlist(Y_hat), na.rm = TRUE), 3), "\n")
#> Predicted probability range: 0 1

# residuals: same list-of-matrices shape, observed minus predicted
resid_list <- residuals(fit)
cat("Residual SD:", round(sd(unlist(resid_list), na.rm = TRUE), 3), "\n")
#> Residual SD: 0.353
The two regression coefficients (intercept and
similarity_dyad) should land close to the simulation truth.
Predicted probabilities span a wide range because dyads with high
similarity have an intercept-plus-effect linear predictor much larger
than dyads with low similarity. Use confint(fit) for the
95% credible intervals on the coefficients.
type = "response" gives predictions back on the natural
scale of the outcome (probabilities for family = "binary",
expected counts for "poisson", expected values for
"normal"). type = "link" gives the underlying
linear predictor (the probit-scale value before the
transform for binary), which is what you want if you plan to compute
marginal effects by hand. For h-step-ahead forecasts on a longitudinal
fit, use predict(fit, h = K) (see the forecasting vignette).
Checking Your Model
Two diagnostics matter for any AME fit. The first is whether the MCMC sampler explored the posterior adequately. The trace plots should mix freely around a stable mean, without trends or stuck regions, and the marginal densities should be unimodal.
trace_plot(fit, params = "beta")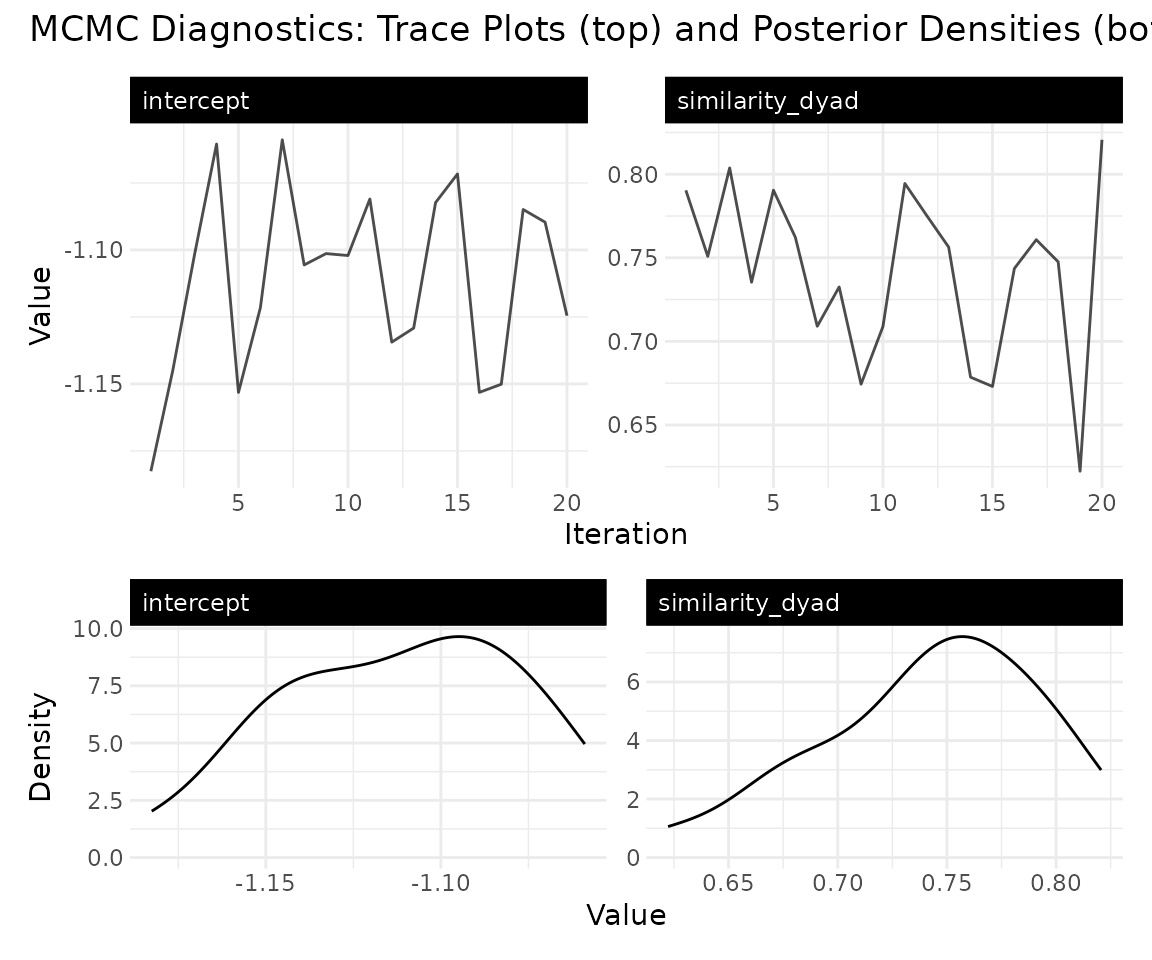
For this fit the two regression parameters, the intercept and
similarity_dyad, mix around the simulation truths of
and
.
The second diagnostic is whether the model reproduces the structural
features of the observed network. Posterior-predictive goodness-of-fit
plots simulate networks from the fitted model and compare their
structural statistics to those of the observed data. The observed series
is dual-encoded as an Okabe-Ito orange (#D55E00) solid line
with points; the posterior-predictive median is grey-dashed and the 95%
credible interval is the grey ribbon. The colour-plus-linetype encoding
stays legible in greyscale and for colour-blind readers.
gof_plot(fit)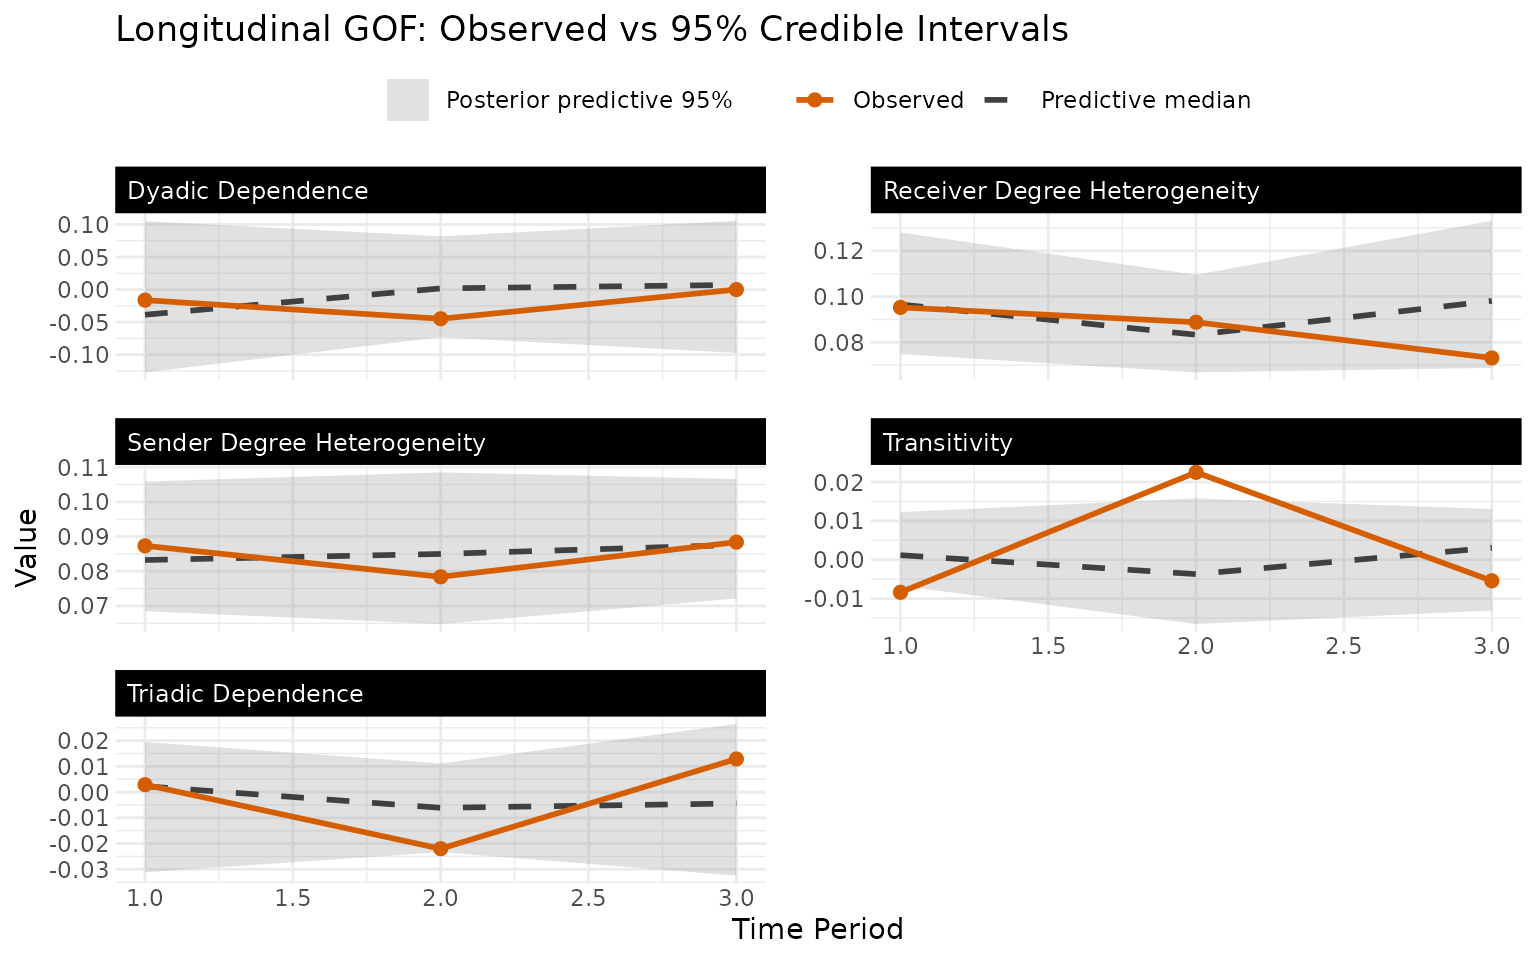
Panel titles use human-readable names (Sender Degree Heterogeneity,
Transitivity, and so on) rather than the underlying column codes such as
sd.rowmean or trans.dep; the internal codes
are what fit$GOF returns directly. Because we generated
this data purely from eta = -1 + 0.7 * X (no planted degree
heterogeneity, reciprocity, or clustering), the model reproduces almost
every structural statistic: across the five statistics and three
periods, fourteen of the fifteen observed values sit inside their 95%
posterior-predictive bands. The lone marginal excursion (transitivity at
one period) sits just past the band edge on a statistic whose values are
all near zero, i.e. Monte-Carlo noise rather than a structural misfit.
On real friendship or trade data the picture is different: at least one
panel, typically Transitivity or Sender Degree Heterogeneity, drifts
clearly outside the band. That misfit is informative: it tells the
analyst which higher-order features AME absorbs through its actor and
latent structure and which remain unexplained. It is a substantive
finding about the data, not grounds to discard the fit.
Visualizing Network Structure
The latent space is where you look for actors playing similar roles in the network:
uv_plot(fit)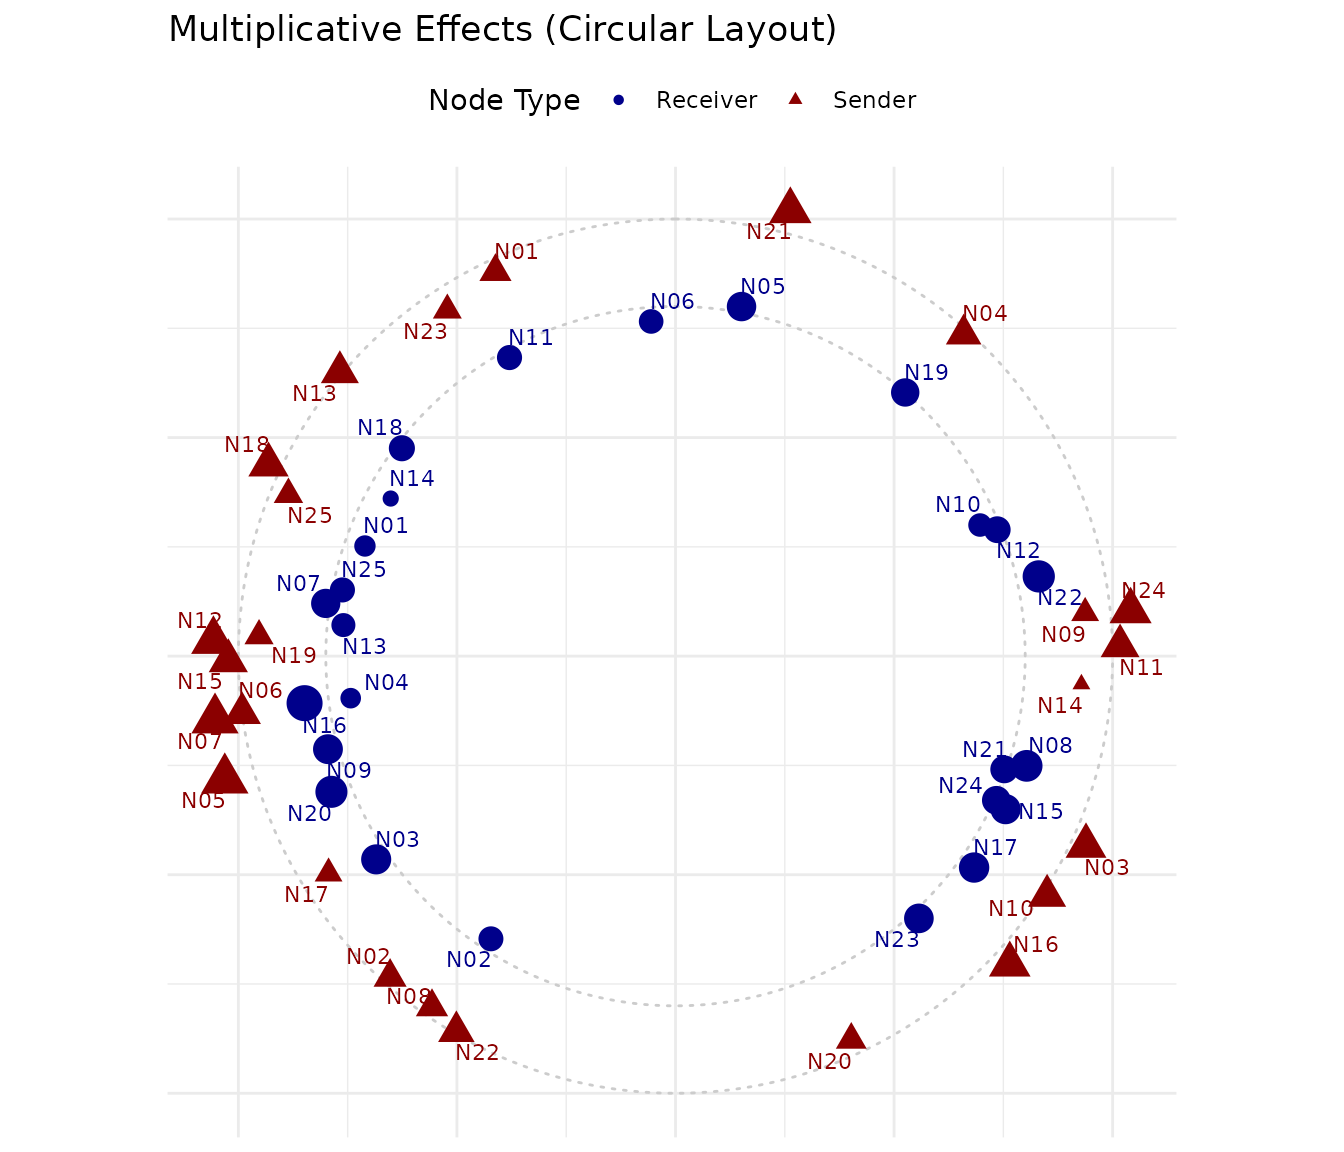
And the additive-effects plot is where you look for unusually active or popular actors:
ab_plot(fit, effect = "sender")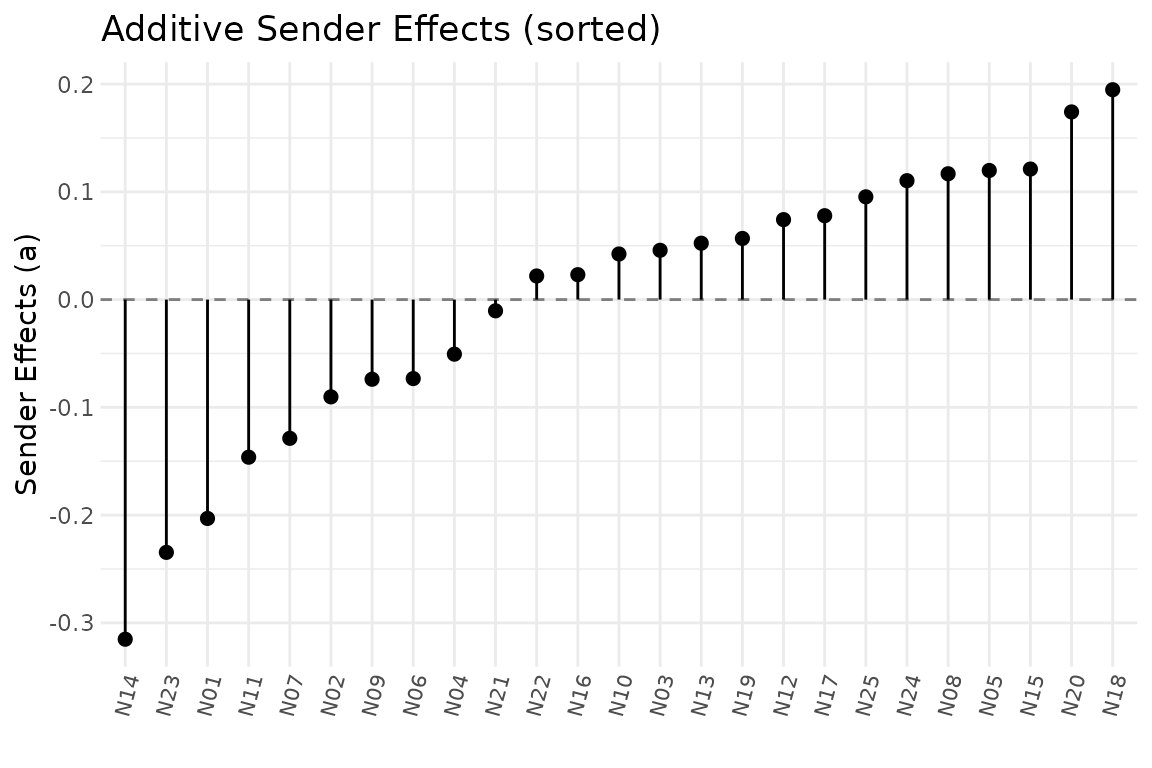
A caveat for this particular example: the simulation planted no
latent structure and no sender/receiver heterogeneity (ties depend only
on the similarity covariate), and the near-zero va and
vb in the summary above confirm the model found essentially
none. The apparent clusters in the latent-space plot and the longer
stems here are therefore sampling noise – treat these two figures as a
tour of the displays, not a substantive finding. On real data these are
the plots where the substantive story lives; see the overview vignette for a friendship network
in which the latent space captures genuine structure.
Cross-Sectional Models
If you have a single network (not a time series), use
ame() instead of lame():
fit_cs <- ame(
    Y = Y_list[[1]],         # just one time period
    Xdyad = X_list[[1]],     # 3-D array [n, n, 1] with "similarity" slice name
    R = 2,
    family = "binary",
    burn = 20,
    nscan = 100,
    odens = 5,
    verbose = FALSE
)

coef(fit_cs)
#>       intercept similarity_dyad
#>       -1.231792        0.776326
The output and methods are the same. The difference is that
lame() pools information across time periods, giving you
more precise estimates when the structure is stable.
Dynamic Effects
When you believe the network structure is changing over time (alliances shifting, friendships evolving), you can let the latent positions and additive effects drift through time. The drift is modelled as an AR(1) process: each period’s value is a noisy copy of the previous period’s value, with a persistence parameter controlling how strongly past predicts present ( near 1 = slow drift, near 0 = each period almost independent).
fit_dyn <- lame(
    Y = Y_list,
    Xdyad = X_list,
    R = 2,
    dynamic_ab = TRUE,    # time-varying sociality/popularity
    dynamic_uv = TRUE,    # time-varying latent positions
    family = "binary",
    burn = 20,
    nscan = 100,
    odens = 5,
    verbose = FALSE,
    plot = FALSE
)

summary(fit_dyn)
#>
#> === Longitudinal AME Model Summary ===
#>
#> Call:
#> [1] "Y ~ dyad(similarity) + a[i] + b[j] + rho*e[ji] + U[i,1:2] %*% V[j,1:2], family = 'binary'"
#>
#> Time periods: 3
#> Family: binary
#> Mode: unipartite
#> Dynamic latent positions: enabled (rho_uv = 0.667 )
#> Dynamic additive effects: enabled (rho_ab = 0.777 )
#>
#> Regression coefficients:
#> ------------------------
#>                 Estimate StdError z_value p_value CI_lower CI_upper
#> intercept         -1.123    0.044 -25.359       0   -1.197   -1.039 ***
#> similarity_dyad    0.754    0.044  17.003       0    0.693    0.847 ***
#> ---
#> Signif. codes: 0 '***' 0.001 '**' 0.01 '*' 0.05 '.' 0.1 ' ' 1
#> Note: stars are a visual hint from posterior mean / SD only; for inference use the credible intervals.
#>
#> Variance components:
#> -------------------
#>     Estimate StdError
#> va     0.068    0.022
#> cab    0.002    0.017
#> vb     0.070    0.023
#> rho   -0.049    0.068
#> ve     1.000    0.000
#>   (va = sender, cab = sender-receiver covariance, vb = receiver,
#>    rho = dyadic correlation, ve = residual variance)
The model estimates how persistent the latent positions are () and how persistent the additive effects are (). Values near 1 indicate slow evolution; values near 0 indicate near-independent positions across periods. The simulated data here use a single latent structure across all three periods, varying only the dyadic similarity covariate, so the persistence estimates reflect a mix of the prior and whatever stable-position signal the chain extracts from three time points. The dynamic effects vignette provides a longer-panel example in which temporal evolution is genuinely present in the simulation and the persistence parameters are informative.
Bipartite Networks
For two-mode networks (students and courses, countries and treaties),
pass a rectangular matrix and set mode = "bipartite". Below
we simulate a 15 row × 10 column network where a dyadic similarity score
again drives the ties.
set.seed(42)          # seed the data simulation so the recovery is reproducible
nA <- 15; nB <- 10
row_names <- sprintf("R%02d", seq_len(nA))
col_names <- sprintf("C%02d", seq_len(nB))
X_bip <- lapply(1:3, function(t) {
    x <- matrix(rnorm(nA * nB), nA, nB)
    array(x, dim = c(nA, nB, 1),
          dimnames = list(row_names, col_names, "similarity"))
})
Y_bip <- lapply(1:3, function(t) {
    eta <- -0.8 + 0.6 * X_bip[[t]][, , 1]
    Y   <- matrix(rbinom(nA * nB, 1, pnorm(eta)), nA, nB)
    rownames(Y) <- row_names; colnames(Y) <- col_names
    Y
})

fit_bip <- lame(
    Y = Y_bip,
    Xdyad = X_bip,
    mode = "bipartite",
    R = 2,
    family = "binary",
    burn = 20, nscan = 100, odens = 5,
    verbose = FALSE, plot = FALSE
)

summary(fit_bip)
#>
#> === Longitudinal AME Model Summary ===
#>
#> Call:
#> [1] "Y ~ dyad(similarity) + a[i] + b[j] + U[i,1:2] %*% G %*% V[j,1:2]', family = 'binary'"
#>
#> Time periods: 3
#> Family: binary
#> Mode: bipartite
#>
#> Note: STATIC fit pooled across 3 time periods --
#>   U, V, a, b are time-invariant; per-period predictions vary
#>   only through per-period covariates. For time-varying effects,
#>   refit with dynamic_uv = TRUE and/or dynamic_ab = TRUE.
#>
#> Regression coefficients:
#> ------------------------
#>                 Estimate StdError z_value p_value CI_lower CI_upper
#> intercept         -0.911    0.073 -12.555       0    -1.05   -0.796 ***
#> similarity_dyad    0.604     0.06   10.01       0    0.503    0.709 ***
#> ---
#> Signif. codes: 0 '***' 0.001 '**' 0.01 '*' 0.05 '.' 0.1 ' ' 1
#> Note: stars are a visual hint from posterior mean / SD only; for inference use the credible intervals.
#>
#> Variance components:
#> -------------------
#>     Estimate StdError
#> va     0.394    0.124
#> cab    0.000    0.000
#> vb     0.519    0.191
#> rho    0.000    0.000
#> ve     1.000    0.000
#>   (va = sender, cab = sender-receiver covariance, vb = receiver,
#>    rho = dyadic correlation, ve = residual variance)
#>   Note: bipartite model (rho fixed to 0, cab fixed to 0)
Notice that the bipartite summary reports cab = 0.000
and rho = 0.000. These two parameters describe
relationships between the sender and receiver of a tie, which
only makes sense when the same set of actors can play both roles. In a
bipartite network the rows and columns are different kinds of entities
(rows = students, columns = courses; rows = donors, columns =
candidates), so a row actor is never also a column actor. There is no
within-actor sender / receiver covariance and no reciprocity from
to
to estimate, and the package fixes both at zero. The
similarity_dyad coefficient should land near the simulation
truth of 0.6 (with this seed the point estimate is about
0.6, a little above the truth, and the 95% interval comfortably covers
0.6). The bipartite vignette walks through
the full workflow.
Supported Data Types
| Family | Data | Example |
|---|---|---|
"normal" |
Continuous | Trade volumes, survey ratings |
"binary" |
0/1 | Friendships, alliances, sanctions |
"ordinal" |
Ordered categories | Conflict intensity (none/threat/action) |
"poisson" |
Counts | Number of co-sponsored bills |
"cbin" |
Censored binary | Friendships with nomination limits |
"frn" |
Fixed rank nomination | “Name your top 5 friends” |
Power-User Features
A few features that show up in advanced workflows but rarely in a first model. Each gets a one-line pointer here rather than a full demo:
-
The
R > n/3warning. Bothame()andlame()warn when the latent-space rank exceedsfloor(n/3)(orfloor(min(nA, nB)/3)in bipartite mode); past that, the multiplicative effects absorb structure that belongs to the additive effects. Advisory, not an error –R = 2orR = 3is the right default. -
Checkpoint / resume for long runs. Pass
max_secondsandcheckpoint_pathwhen a run may hit a wall-clock limit, then continue withresume_from; see?lame_resumefor the resume-cycle semantics. -
K-panel joint posterior.
lame_multi()fits K parallel networks and pools the per-panel beta posteriors into one precision-weighted shared posterior; see?lame_multi. -
Memory-conscious
loo().save_log_lik = "chunked"streams the log-likelihood matrix to disk instead of RAM, andloo(fit)reads it back transparently; see the dynamic effects vignette. -
Multi-chain diagnostics.
lame_parallel(..., n_chains = 4)plusrhat_dynamic_beta()give a between-chain ; see the dynamic effects vignette. -
Held-out predictive scoring. Mask dyads to
NA, refit (the sampler imputes them), and score the masked cells withevaluate_heldout(). AUROC / PR-AUC requireprecrec(or AUROC alone viapROC); both are optional and the helper degrades gracefully when neither is installed. See the cross-sectional vignette for a worked example.
The one code pattern worth spelling out is checkpoint / resume:
ck <- tempfile(fileext = ".rds")
fit1 <- lame(
    Y = Y_list, Xdyad = X_list, R = 2, family = "binary",
    nscan = 5000, burn = 200, odens = 25,
    max_seconds = 30,          # stop after 30 s wall clock
    checkpoint_path = ck,      # write state here
    verbose = FALSE
)
if (isTRUE(fit1$terminated_early)) {
    # `nscan` on the resume call = additional stored draws
    fit2 <- lame(resume_from = ck, nscan = 2000)
}
Where to Go Next
| I want to… | Read this |
|---|---|
| Understand the full workflow with real data | lame overview |
| Learn about cross-sectional models in depth | Your first AME model |
| Model two-mode networks | Bipartite networks |
| Let the network structure evolve over time | Dynamic effects |